In this lesson you will learn about discrete random variables. In particular, you will learn the definitions of the probability mass function, the expected value or mean, the variance, and the standard deviation of a discrete random variable. You will learn how to calculate the variance of discrete random variables using the law of the unconscious statistician, and you will learn what it means for two discrete random variables to be independent.
Let \(S\) be the sample space, that is, the set of all outcomes of a random experiment.
A random variable, say \(X,\) is a rule that assigns to each outcome \(s\) of the sample space \(S\) a number \(X(s).\)
The term random variable
may be misleading since it is really a function and not a variable. Random variables are usually denoted by capital letters from the end of the alphabet. They are useful for describing events. Here is an example.
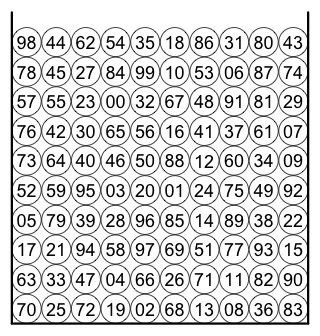
| An urn contains 100 balls labeled with the two digit numbers \(00, 01, 02, \ldots , 99.\) A ball is randomly selected. Let \(X\) be the first digit and let \(Y\) be the second digit. Find the probabilities of the following events: \(X=3,\) \(Y\neq 3,\) \(X\neq Y,\) \(X \gt Y,\) \(X\leq Y,\) \(X+Y=9,\) \(X\lt 4 \mbox{ and } Y\lt 3.\) |
| The event \(X=3\) consists of all outcomes for which the first digit of the labeled ball is a 3. The expression \(X=3\) is a short hand for the event \(\{s\in S | X(s)=3\}.\) | 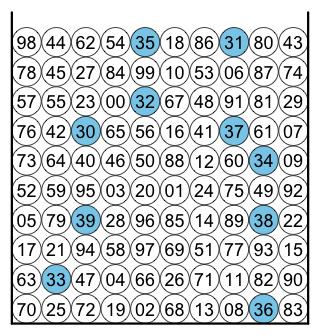 |
Explicitly, \(X=3\) is the event \(\{30, 31, 32, 33, 34, 35, 36, 37, 38, 39\}.\)
Since all outcomes of the sample space \(S\) are equally likely, the probability of an event \(E\) is given by the formula \(P(E)=|E|/|S|.\) Therefore \[P(X=3)=\frac{|X=3|}{|S|}=\frac{10}{100}=\frac{1}{10}.\]
The event \(Y\neq 3\) consists of all outcomes for which the second digit of the labelled ball is not a 3. \[P(Y\neq 3)=1-P(Y=3)=1-\frac{1}{10} = \frac{9}{10}.\] The calculation of the probabilities for the remaining events will be left as an exercise to the reader.
So far we've only discussed sample spaces with finitely many outcomes. Consider the random experiment of tossing a coin until heads occurs; denote the number of tosses by the random variable \(X.\) In this case, the number of outcomes is countably infinite.
A random variable that assumes finitely many or countably infinite many distinct values is called a discrete random variable.
Let \(X\) be a discrete random variable. \(X\) is described completely if we specify the probability \(P(X=x)\) for every real number \(x.\) The function that assigns to each value \(x\) the probability \(P(X=x)\) is called the probability mass function. We denote the probability mass function by \(p(x).\) Here is an example.
Let \(X\) be the number of times heads occurs in 3 coin tosses. Then the probability mass function \(p\) of the random variable \(X\) could be specified by the table
| x | 0 | 1 | 2 | 3 |
|---|---|---|---|---|
| p(x) | 1/8 | 3/8 | 3/8 | 1/8 |
or by the formula \[p(x) = \frac{3}{4(3-x)!x!} \mbox{ for } x=0, 1, 2, 3. \] Recall that \(x!\) (read: x factorial) denotes the product of the first \(x\) natural numbers, e.g., \(3! = 3\cdot 2\cdot 1,\) and that \(0!=1.\) Also note that \(p(x) = 0\) for all numbers \(x\) different from \(\{0, 1, 2, 3\}\), even though this is not explicitly stated.
For any discrete random variable \(X\) the probabilities \(p(x)\) must all be nonnegative numbers and the sum of all the probabilities has to be 1. In formulas,
\[\begin{align*} & p(x) \ge 0 \mbox{ for all } x \mbox{, and} \\ & \sum_{x}p(x)=1. \end{align*}\]
Furthermore, the probability of the event \(X\in A\) is calculated by the formula \[P(X\in A) = \sum_{x\in A}p(x).\] In words: the probability that \(X\) will assume a value in the set \(A\) is the sum of the probabilities corresponding to all values \(x\) of \(A.\)
Suppose that \(X\) denotes the number of dollars won in a certain game. Suppose that the game has the following distribution.
| x | -1 | 10 | 200 | 400 |
|---|---|---|---|---|
| p(x) | 0.980 | 0.017 | 0.002 | 0.001 |
Winning
an amount of -1 dollars means the same as losing 1 dollar. Suppose that you played that game many times, to be specific, let's say 1000 times. How much money would you expect to win in a 1000 games?
Using the frequency interpretation of probability we would expect to win
-1 dollar about 980 times, 10 dollars about 17 times, 200 dollars about 2 times, and 400 dollars about 1 time. The expected total amount of winnings in 1000 games is therefore
\[(-1)\cdot 980 + 10\cdot 17 + 200 \cdot 2 + 400 \cdot 1. \]
Dividing this expression by the number of games will give us the amount of money that we expect to win in a single game in average. Dividing by 1000 we get
\[(-1)\cdot 0.980 + 10\cdot 0.017 + 200 \cdot 0.002 + 400 \cdot 0.001 = -0.01, \]
that is, the expected winnings are -0.01 dollars per game. In other words, we lose 1 cent in average per game. This value is called the expected value or the mean of \(X\) and is denoted by \(E[X]\) or \(\mu_X.\) This example motivates the following definition.
If \(X\) is a discrete random variable, then the expected value or mean of \(X\) is given by \[E[X] = \mu_X = \sum_{x}x\cdot p(x).\]
Suppose \(X\) is a discrete random variable and \(g\) is a function from the real numbers into the real numbers. Then \(Y = g(X)\) is another discrete random variable and its expected value can be calculated using the following result.
\[E(g(X)) = \sum_{x}g(x) p(x) .\]
This result, which is a mathematical theorem, is often used without stating a name for it. Sometimes it is referred to as the "law of the unconscious statistician" since it has been used by unconscious
statisticians as if it were a definition.
We define the variance of a random variable as the average
squared deviation from its mean.
Let \(X\) be a discrete random variable. Then \(E[(X-\mu_X)^2]\) is called the variance of \(X\) and is denoted by \(Var(X)\) or \(\sigma^2_X.\) The square root of \(Var(X)\) is called the standard deviation and is denoted by \(\sigma_X.\)
For example let \(X\) be a discrete random variable whose distribution is given by the following table.
| x | -1 | 10 | 200 | 400 |
|---|---|---|---|---|
| p(x) | 0.980 | 0.017 | 0.002 | 0.001 |
Then \(\mu_X=-0.01\) and by the law of the unconscious statistician \[\begin{align}Var(X) & = E((X-\mu_X)^2) = \sum_{x}(x-\mu_X)^2 p(x) \\ = & (-1+0.01)^2\cdot 0.98 + (10+0.01)^2\cdot 0.017 \\ & + (200+0.01)^2\cdot 0.002 + (400+0.01)^2\cdot 0.001\\ = & 242.6779.\end{align} \] The standard deviation of \(X\) is \(\sigma_X=\sqrt{Var(X)}=\sqrt{242.6779}\approx 15.5782\) (rounded to 4 digits).
Suppose a factory produces marbles in three sizes (small, medium, and large) and two colors (orange and blue).
Here is the distribution of colors
and size
for the factory.
| size | ||||
|---|---|---|---|---|
| small | medium | large | ||
| color | orange | \(\frac{2}{24}\) | \(\frac{3}{24}\) | \(\frac{1}{24}\) |
| blue | \(\frac{6}{24}\) | \(\frac{9}{24}\) | \(\frac{3}{24}\) | |
The table indicates that \(2/24 = 1/12\) of all marbles are orange and small, \(3/24 = 1/8\) of all marbles are orange and medium, and so on.
Suppose you are given a randomly selected marble from this factory. What are the chances that this marble is orange?
The marble could be orange and small, orange and medium, and orange and large. Therefore the probability that the marble is orange is \[\frac{2}{24}+\frac{3}{24}+\frac{1}{24}= \frac{6}{24} = \frac{1}{4}.\]
Suppose you are told the size of that marble. Does that change the probability that the marble is orange?
To answer this question, recall the concept of conditional probability. Alternatively, you could imagine that the factory only produces 24 marbles each and use the resulting frequencies of marbles to find the answer.
Either way, you find that the marble is orange with probability 1/4, regardless of whether or not you know its size. In fact, the probability for a certain color is independent from its size and the probability of a certain size is also independent from its color. We describe such a situation by saying that the variables colors
and size
are independent.
In general, two variables, such as colors
and size
, are said to be independent if their joint distribution is obtained by multiplying the marginal distributions. For example, the probability that the marble is orange and medium is \(3/24 = 1/8,\) which is the product of the probability that the marble is orange \((1/4)\) and the probability that the marble is medium \((1/2).\)
Suppose that two discrete random variables, say \(X\) and \(Y,\) are defined on the same sample space \(S.\) Then the random variables \(X\) and \(Y\) are said to be independent if the joint distribution of \(X\) and \(Y\) is the product of the marginal distributions of \(X\) and \(Y,\) that is, if \[P(X = x \mbox{ and } Y = y) = P(X = x)\cdot P(Y = y)\] for all \(x\) and \(y.\)
Intuitively,two random variables are independent if some information about one of them will not give any information about the other. Suppose for example, that I roll a die twice. Telling you the outcome of the first roll will not help you predict the outcome of the second roll.
Consider again the example where the random variable \(X\) has the distribution described by the table below.
| x | -1 | 10 | 200 | 400 |
|---|---|---|---|---|
| p(x) | 0.980 | 0.017 | 0.002 | 0.001 |
You could use R as follows to find the expected value, variance, and standard deviation of \(X.\)
| x = c(-1, 10, 200, 400) |
| prob = c(0.98, 0.017, 0.002, 0.001) |
| sum(x*prob) |
| expected = sum(x*prob) |
| sum((x-expected)^2*prob) |
| variance = sum((x-expected)^2*prob) |
| sqrt(variance) |