ACSII II Guide to Geometric Morphometrics in MorphoJ
11. Canonical Variate Analysis
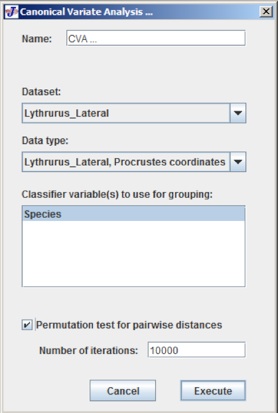
Canonical variate analysis is a method used to find shape features which maximize the separation between groups. For this analysis group is assumed to be known apriori. For exploration taxonomy, CVA is generally inappropriate. You need to have a justifiable reason for defining groups. For CVA analysis select Canonical variates under comparison and the following dialog box opens:
At the very top of this dialog box is a drop down menu to select what kind of analysis to run and by default it does a CVA.
The Dataset drop down menu gives an option to choose a dataset and here in this example it is the Lythrurus_Lateral. As the dataset is selected the Data type and Classifier variables are available to be selected for the next two elements of the dialog box.
At last, there is a check box that can be selected for a permutation test of pairwise distances between the groups. Click the Execute button to run the analysis.
Graphical Output: As the CVA analysis is done there are two graphical outputs under the Graphics tab. One of them is CV Shape Changes, which shows the shape change associated with the CV axes. The number of axes is the number of species minus one. The other graphical output is CV scores, which is the scatter plot of the CV scores.
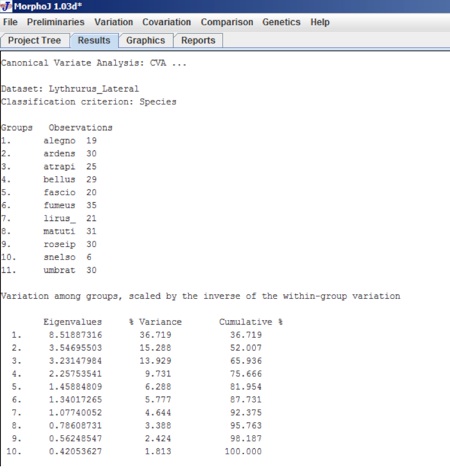
To view the results, choose the Results Tab. The following screen shot shows some of the elements of the user interface:
At the very beginning of the test output it gives information about the name of the analysis, dataset, number of groups etc.
The first entries are how many groups, the criteria to make the groups and how many individuals are in each group.
The second table shows the amounts of variation among groups. In this table there are 3 columns. First column gives the amounts of variation among groups, 2nd column is the percentage of the total for each CV and last column is the cumulative percentage.
The next two entries are matrices for Mahalanobish distance and Procrustes distance among all possible pairs of groups. If the option for Permutation test was selected during the analysis it gives two matrices with P values for all the pairwise tests for Mahalanobis and Procrustes distances.
Finally is a table with canonical coefficients which is related to the original shape coordinates to the CV scores.