ACSII II Guide to Geometric Morphometrics in MorphoJ
10. Principal Component Analysis
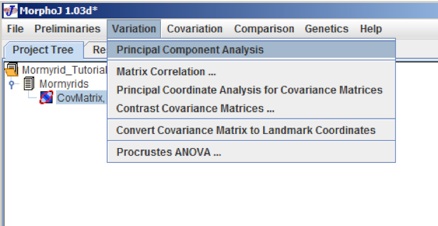
Principal Component Analysis (PCA) is very important for a lot of studies as it shows major shape variation. It is one of the most widely used methods for multivariate analysis. In MorphoJ, PCA is calculated from the covariance matrix. To run a PCA select CovMatrix from the Project Tree window and click on Principal component Analysis (PCA) from the Variation menu. During selection the project tree window looks like the following:
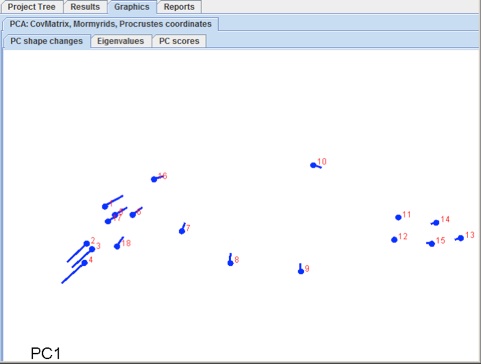
As we click on the PCA it gives two types of output, graphical and printed output. Graphical output has three tabs which are PC shape Changes, Eigenvalues and PC Scores. Clicking on any of these tabs show the graphical output. If some one selects the the PC shape changes tab the following window appears:
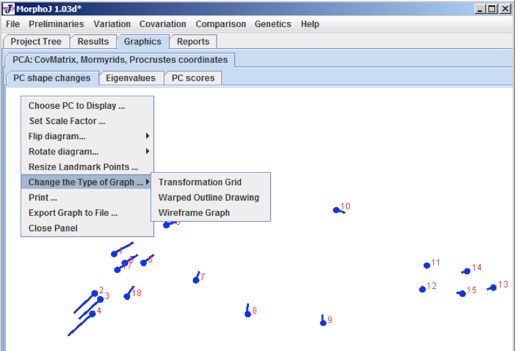
There are options that the PC could be changed and other modifications to the graph is possible as well. If we right click, the text box shows up with the options: Transformation Grid, Warped Outline Drawing, and Wireframe Graph. These will give you different ways of visualizing changes along the different PCA axes. For a Warped Outline Drawing, an outline will have to be created in a program like the tps package and entered under Preliminaries.
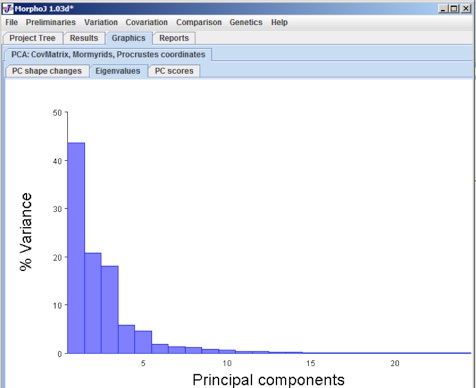
The Eigenvalue graphical window shows the relative percentage of principal components, where all PCs account for 100%. In shape analyses, the number of axes is the number of landmarks times the number of dimensions minus the degrees of freedom (4 for 2D). If the Eigenvalues are chosen under graphical tab the following window shows up. In general, no more than the first 5 axes show enough variation to be useful.
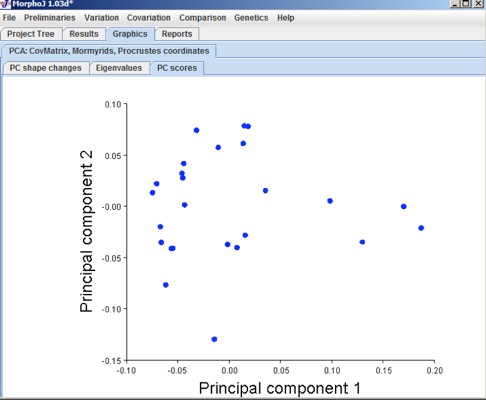
Selecting PC scores under Graphics tab gives the following user interface window:
This is the scatter plot of PC scores. This graph is only produced if the covariance matrix on which the PCA is derived, directly comes from a dataset.
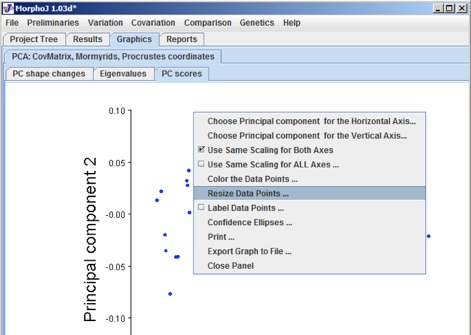
Right click on this scatter plot giver the following tab which gives lots of option to edit the scatter plot and also how to save and export the graph.
Showing Output Report as Text:
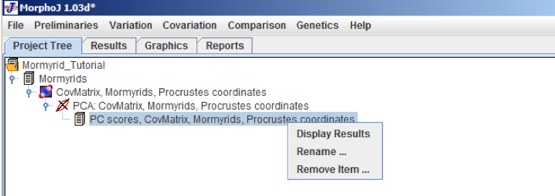
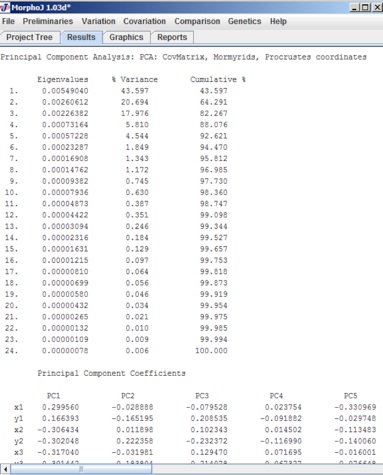
To see the text output for PCA choose Results and they are output as eigenvalues and PC coefficients.
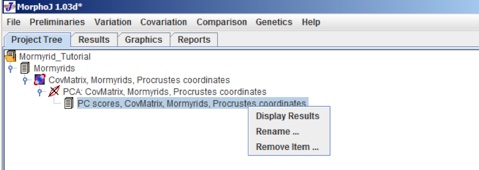
The other way to see the report is selecting the Project tree window and right click on the PCScores and click result:
After clicking the following user interface window appears with the text output under the Results tab the text output in the Results window contains the following information:
The text output contains two tables, one is Eigenvalues and the other is PC coefficientns.
Eigenvalues: In this table there are 3 columns. The first one is eigenvalues for each corresponding PC axis and the second one is as a percentage of the total variance. The third column is the cumulative percentage of total variance.
PC coefficients: The PC coefficients or eignevectors are in a tabular form which includes all the PC coefficints.In this coefficient table columns contain coefficients for one principal componenet.