# of Blue:
# of Red:
Target Class =
Non-target Class = Red
Proximity Map =
Proximity Regions
PCD
MDS
HOW TO USE THIS DEMO
- PCDs are constructed for each class: one being the target and the other is the non-target class. Hence, e.g. Blue points can be the target class and Red points can be the non-target class, and vice versa. See Proximity Catch Digraphs.
- Target Class: When selecting the Target Class as Blue (Red), the non-target class is automatically set to Red (Blue). Also, the Delaunay Tesselation is drawn for the Red (Blue) points. Proximity Regions, PCDs and MDSs are also presented for the Red (Blue) points.
- Sample: When the "Sample" button is pressed, points from two classes (i.e., red and blue points) are randomly generated in (0,620)x(0,380). You may specify the number of points in each class by changing the default values in the boxes at the bottom of the demo.
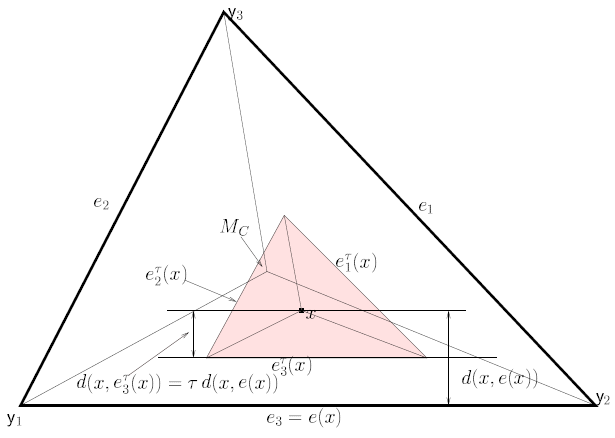
- Proximity Map: There are three proximity map families to choose in the menu. They are Spherical, Proportional Edge (PE), and Central Similarity (CS) proximity maps. When selected, plotted proximity regions and PCDs change. With each selected proximity region, a brief description appear on the right. You may change the parameters \(r\) or \(\tau\) at boxes at the right side of the demo.
- Delaunay: Draws the Delaunay Tasselation of the Red (Blue) points. Not valid for spherical proximity map. See Delaunay Tesselation.
- Proximity Region: This button draws the proximity region associated with each Blue (Red) point. The type of proximity region is selected from the Proximity Region menu below.
- PCD: This button shows the arcs (i.e. directed edges) of the PCD of the Blue (Red) points. The PCD is associated with proximity map family selected in Proximity Region menu below. That is, for example, if PE proximity map is selected, the corresponding digraph is the PE-PCD.
- MDS: Highlights the Blue (Red) points of the minimum dominating set (MDS) of Blue (Red) PCDs. If the proximity regions button is selected, draws the proximity regions of points which are the members of the MDS. MDSs are equivalent to solutions of Class Cover Problem with minimum number of Proximity Regions (see Cannon and Cowen (2000) for more on the class cover problem). MDSs of the Blue (Red) PCDs are given with the Greedy Algorithm.
Maintained by A. Manukyan & E. Ceyhan (demo is prepared by A. Manukyan)
Last modified: Oct 16, 2022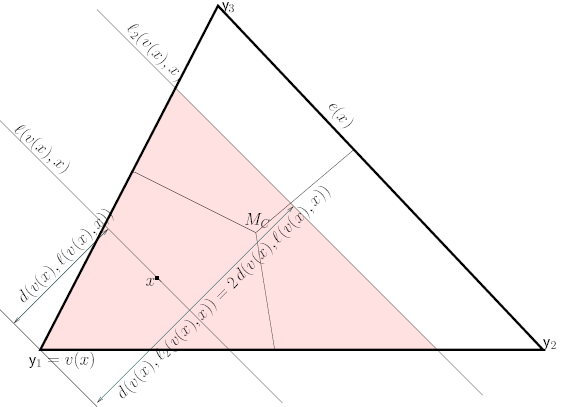
Spherical Proximity Map: \(N_{S}(\cdot)\)
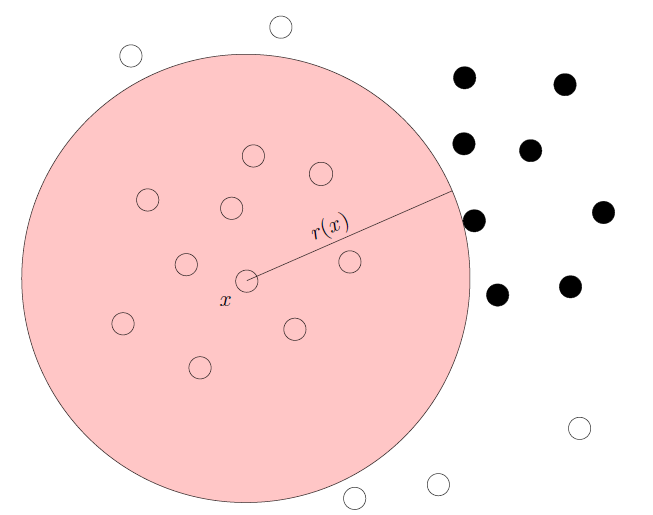
- Let \( \mathcal{X}=\{x_1,x_2, \cdots, x_n\} \), \( \mathcal{Y}=\{\mathsf{y}_1,\mathsf{y}_2,\cdots,\mathsf{y}_m\} \) be two classes, and let \( d(x,y)\) is the \(L_2\) metric (Euclidean) distance. Here: $$v(x) = \arg\min_{y \in \mathcal{Y}} d(x,y)$$
- \(B(x,r(x))\) is the ball centered on \(x\) and with radius \(r(x)=d(x,v(x))\). Thus; $$N_{S}(x) = B(x,r(x)).$$